From D3.js to MySTMD: My Experience as a POSSEE Intern
My name is Ulises Rivero, and I am from Mexico. I am currently pursuing a bachelor’s degree in Applied Technology at BYU Idaho. This post is about my experience contributing to open source with the POSSEE (Practical Open Source Sustainability Experiences for Education) program. I had the opportunity to work in this program for the last 12 weeks, and it was a fantastic experience. My two projects were focused on D3.js and MySTMD. I want to highlight some of the key experiences I had during this time, which may help those who are considering starting a career in software development.
Although I already had some experience in web development and data analysis, I realized that there is still much for me to learn. Therefore, research and study played essential roles in my experience.
Working with D3.js
One of my first assignments was to present the results of the 2020 NumPy user survey using D3.js, a JavaScript library for creating interactive and dynamic data visualizations in the browser. When I accessed the repository, I found initial directories and some files containing the survey responses. However, the data was not in a usable format for analysis, so I conducted some research and concluded that the responses needed to be stored in a .JSON file to begin the analysis.
After preparing the dataset, I started creating visualizations. Even though I had some experience with JavaScript, I was unfamiliar with D3.js. To bridge this gap, I explored the D3.js website, the MDN Web Docs site, the dart.dev API, the D3 in depth website, the react.dev website, and the reactnative.dev website, which provided tutorials and examples. I successfully created a few charts, but my initial results lacked interactivity and visual appeal.
My mentor suggested I use the JetBrains Python survey as an example, as their D3.js charts were dynamic, visually appealing, and user-friendly. Inspired, I examined their website using the Chrome DevTools, only to discover that their charts were dynamically rendered using React alongside D3.js. After discussing this with my mentor, we decided to use React for the project, which required me to study React and its integration with D3.js.
Through tutorials and further research, I improved my knowledge of D3.js, enabling me to create more polished and visually appealing charts. While my charts remained static, they closely resembled the high standards set by the JetBrains examples. Once all visualizations were complete, I deployed the project as a webpage via Netlify.
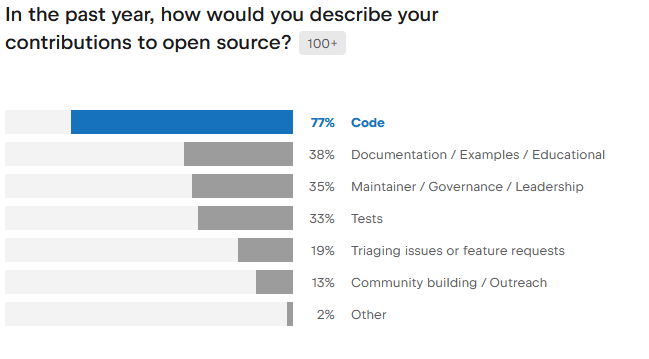
Another project I worked on during my internship with POSSEE was related to the 2024 scikit-learn user survey. This project was similar to the NumPy survey but required using Python in a Jupyter notebook, with visualizations integrated into a web page using MySTMD.
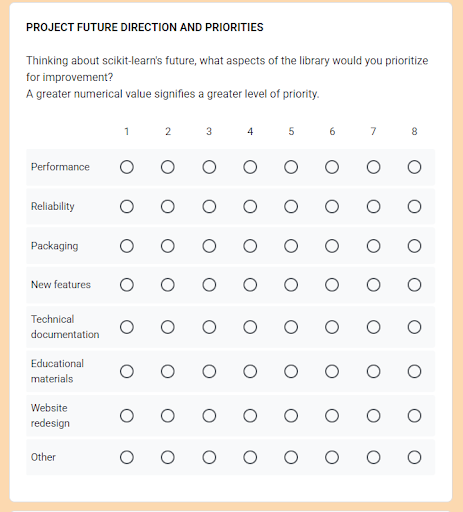
The survey responses were stored in .csv files, one for each of the six supported languages: English, Spanish, French, Portuguese, Mandarin, and Arabic. My first task was to combine these files into a single master dataset which was easy for the most part. However, visualizing the responses to the question about the project’s future direction and priorities, and the question about the prioritization of ML tasks proved to be tricky. Unlike other questions that could be represented with simple bar charts, these questions required a more nuanced approach due to their multi-column structure.
Project Future Direction and Priorities question from the scikit-learn survey questionnaire
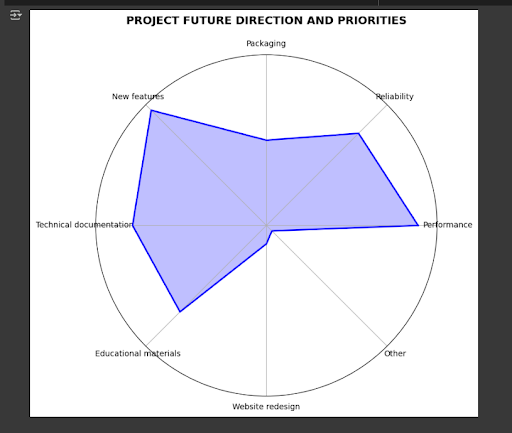
After researching potential solutions, I proposed two options: a stacked bar chart and a spider chart. Both were implemented and included on the final page.
scikit-learn spider charts for the Project Future Direction and Priorities question.
While subsequent visualizations were easier to create, integrating them into a MySTMD-based web page took some time. Since this tech stack was new to me, I had to do some research on Markdown, MyST project structure, and converting .ipynb files from Google Colab for integration into MySTMD.
My mentor introduced me to dropdown admonitions, which allowed code snippets to be hidden or revealed as needed, enhancing usability. However, rendering charts dynamically within the webpage without relying on .png images proved not to be the best option for the project’s objectives. My mentor emphasized the importance of communicating constraints and providing solid arguments when decisions must be made–one of the most valuable lessons I learned during this project.
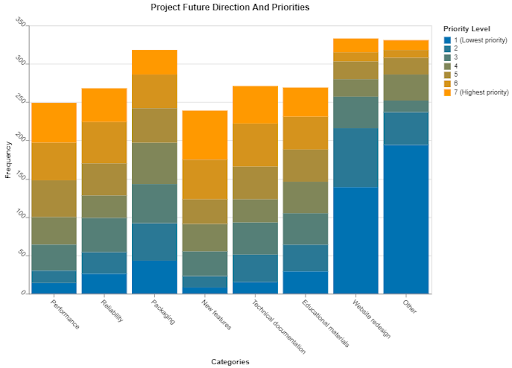
scikit-learn stacked bar spider charts for the Project Future Direction and Priorities question.
To address the situation, we transitioned from Bokeh to Altair for the visualizations as Altair was more efficient for our use case. While spider charts were difficult to implement with Altair, stacked bar charts were a breeze, so we opted to exclude spider charts. I refactored the code, integrated the visualizations as .png images, and prepared the project for deployment.
GitHub and More
In the 12 weeks of internship, I also had the opportunity to deepen my knowledge of GitHub – working with feature branches, issues, and merging pull requests. Daily practice of using GitHub prepared me for future collaborative projects, where maintaining an organized and transparent development process is crucial.
Surprisingly, one of the most valuable lessons I had was related to the best practices in project management, such as effective communication, scoping the work, identifying concrete deliverables, and dividing work into parts. These skills are just as crucial as technical expertise, as they ensure that projects are delivered on time and meet the expectations of the stakeholders.
Conclusion
This internship reinforced that software development is as much about adaptability, problem-solving, and effective communication as it is about coding. Although I came in with a strong foundation from my academic studies and certifications, I encountered numerous new technologies that required self-learning and focused research in order to succeed.
For those considering a career in software development, I encourage you to embrace continuous learning, seek guidance from experienced mentors, and take on challenges that push you beyond your comfort zone. The POSSEE program provided me with an opportunity to learn and grow, and I look forward to applying these lessons in my future career.